Share
Main Conclusions
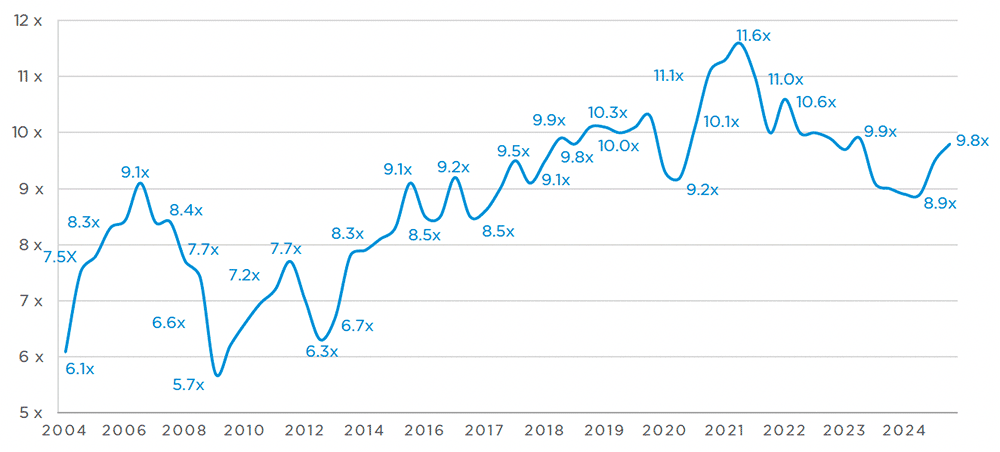
The Argos Index® continued its recovery to 9.8x EBITDA
The Argos Index® confirmed its rebound to 9.8x EBITDA in Q4, up 3% from Q3. The index was pulled by the lower mid-market (after four quarters of stability), and by both investment funds and strategic buyers.
Prices were backed by the continued recovery of the mid-market M&A activity (deals volumes increased by 13% in 2024) and of the LBO market (volumes up 22%). They benefited from improving financial conditions with lower inflation (1) and interest rates with expected further cuts by the ECB, lower cost of capital and easier access to deal financing. However, this recovery is hindered by an adverse macroeconomic, internal politics and international context for the eurozone.
The situation in France highlights the risk weighing on the eurozone M&A activity and prices. The political turmoil following the July elections had a clear impact on the mid-market activity in the 2nd semester. Deal volume in France (2) dropped by 15% while increasing by 16% for the rest of the eurozone. Given the time lag for transactions, the impact on valuations remains limited at this stage.
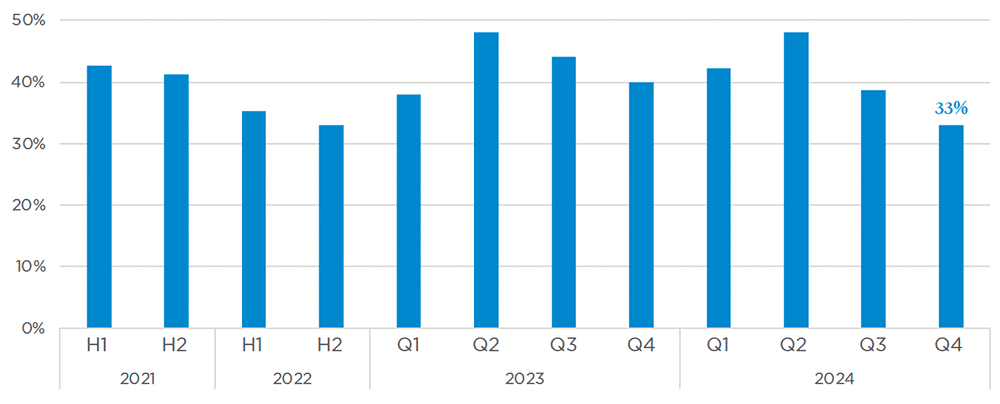
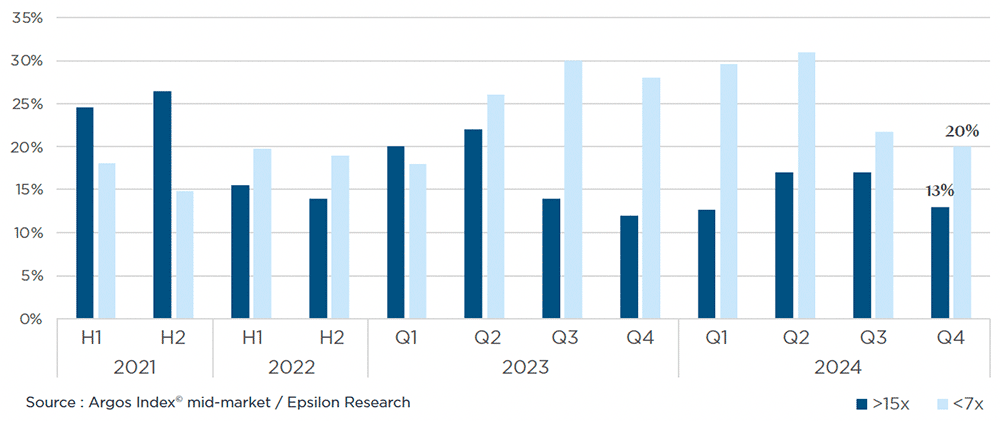
Despite the specific risk in France, the eurozone market was less polarized in Q4 (as in Q3) as the M&A activity and prices recover. The share of extreme multiples was down to 33% of the Argos Index® sample (below its 5 years average) and transactions below 7x EBITDA continued to drop to 20% of the sample. The standard deviation of 3.8x EBITDA is also at low levels.
(1) Eurosystem Staff Projections (as of Dec.2024) forecast headline eurozone inflation was 2.4% in 2024, 2.1% in 2025 and 1.9% in 2026. Their expected GDP growth rate was 0.7% for 2024.
(2) Estimates as of 15.01.2025 by Epsilon Research / MarketIQ
Argos Index® mid-market
Median EV/EBITDA multiple on a six-month rolling basis
Source : Argos Index© mid-market / Epsilon Research
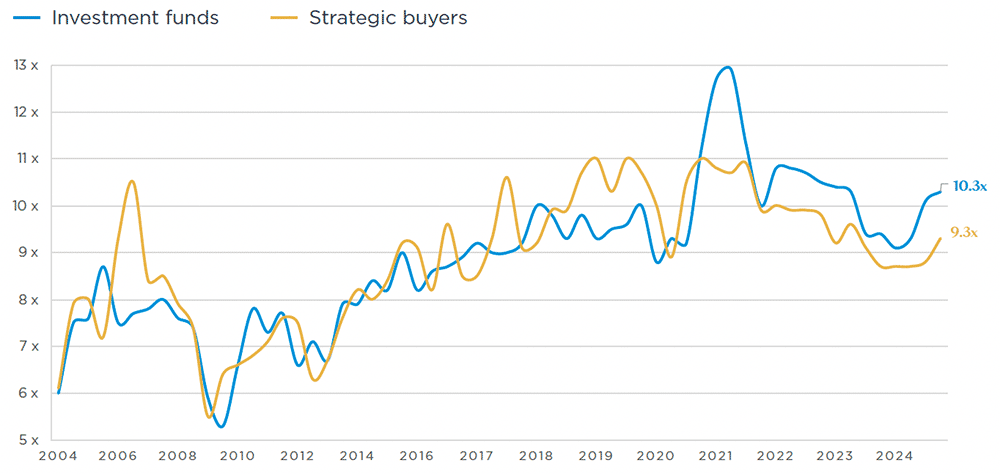
The Argos Index® is pulled by both investment funds and strategic buyers
Multiples paid by investment funds are up 2% to 10.3x EBITDA, as they benefited from the lower interest rates, decreasing borrowing costs (1) and easier access to deal financing (2). They were also backed by the uptrend LBO market and exit activity in 2024, as funds hold a record number of companies up for sale in their portfolio (3).
Multiples paid by strategic buyers were also up at 9.3x EBITDA in Q4, depite the public equity markets downturn (4). Large corporates are more active as they look for transformative acquisitions on the face of structural changes (impact of AI in the service activities, of energy costs in the industrial sectors).
The gap between multiples paid by investment funds and strategic buyers is still at high 1.0x EBITDA, in line with the 0.9x average since 2021, as investment funds keep on targeting higher quality assets. The average EBITDA margin of companies acquired by funds was 20% vs. 18% for strategic buyers in S2 2024.
(1) In 2024 cost of BB debt was down 111bp at 4.25%; and of B debt 124bp at 5.67% (Source: Les Echos, 14.01.2025).
(2) LBO debt volumes (“Term Loan B”) were at a record high in 2024, at €305bn, although it was mainly for deal refinancing (ibid).
(3) The stock of companies held by European PE funds more than 6 years has grown by 70% in 10 years to 12.000 (in 2024), according to Goldman Sachs (in Les Echos, 28.11.2024).
(4) The EURO STOXX® TMI Small decreased by 3.4% between Q3 and Q4 2024 and by 2.3% over the year.
Enterprise value / historical EBITDA
Source : Argos Index© mid-market / Epsilon Research
Continued decresase of transactions at extreme multiples
A third of the Q4 2024 transactions are at extreme multiples below 7x or above 15x EBITDA, a clear decrease since 2023 / S1 2024, as the M&A market activity and multiples recover.
Share of transactions at extreme multiples (15x EBITDA)
Source : Argos Index© mid-market / Epsilon Research
Share of transactions at multiples >15x EBITDA Argos Index® sample
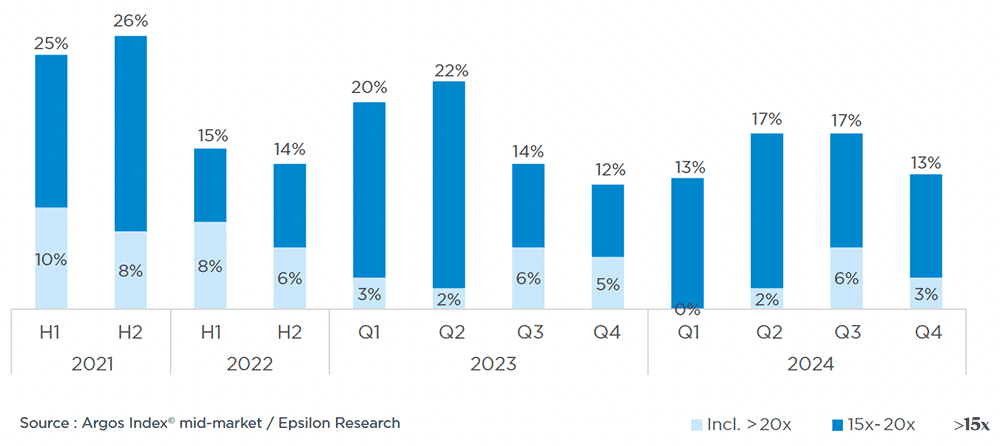
Transactions at multiples below 7x EBITDA account for 20% of analysed transactions, back to their 2021/2022 level.
Share of transactions at multiples 15x EBITDA Argos Index® sample
Sharp decrease in French volumes, in contrast
with the rebound in the rest of the Eurozone
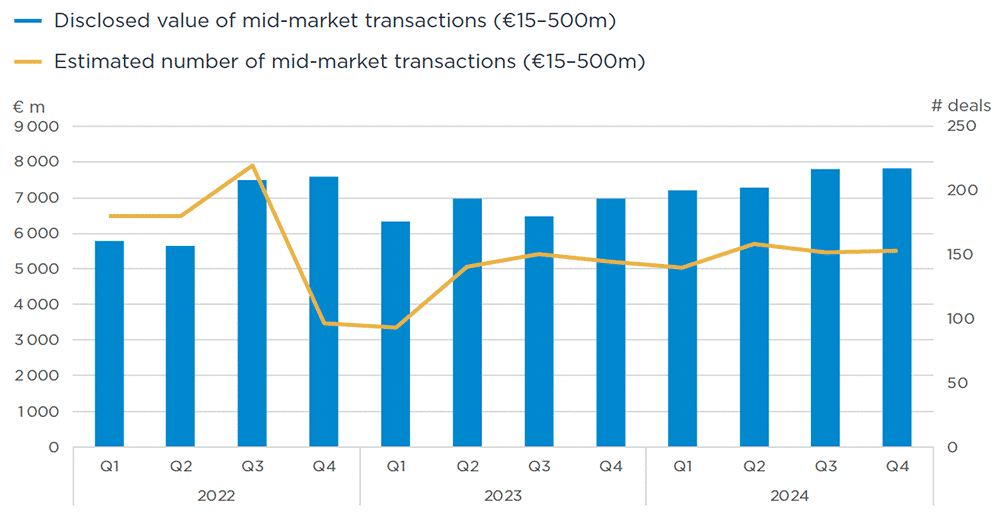
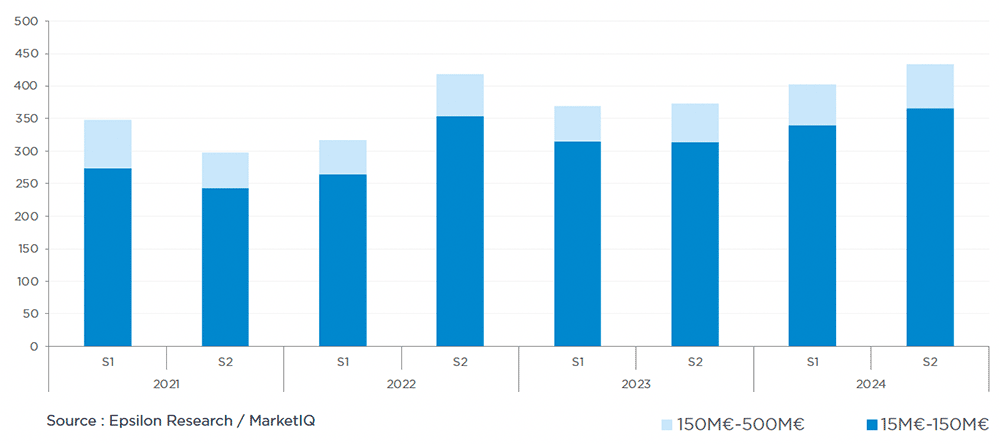
The (estimated) Euro zone mid-market M&A activity was stable in both volume and value in Q4 vs. Q3, but the trend is upward since 2023. For the full 2024-year, activity increased by 13% in volume and 14% in disclosed value vs. 2023, while the 2nd semester deal volume was up 8% vs. S1.
The recovery of the mid-market was backed by the global M&A market rebound (1) with renewed activism from both corporates and private equity funds after 3 years of decline, fuelled by improving financial conditions: lower interest rates, as inflation quickly drops to the 2% target with the prospect of further ECB rate cuts, and strong debt markets as lender financing appetite continue to improve. However, this is still a slow process in a challenging economic outlook: weak growth forecasts, political turmoil and geopolitical threats hinder a quicker eurozone M&A rebound.
The political uncertainty in France since the July elections have a clear impact on the M&A activity: the mid-market deal volume (2) was down 15% in S2 2024 (vs. S1), while it increased by 16% in the rest of the eurozone (+12% in Germany, +16% in Italy, +26% in Spain & Portugal).
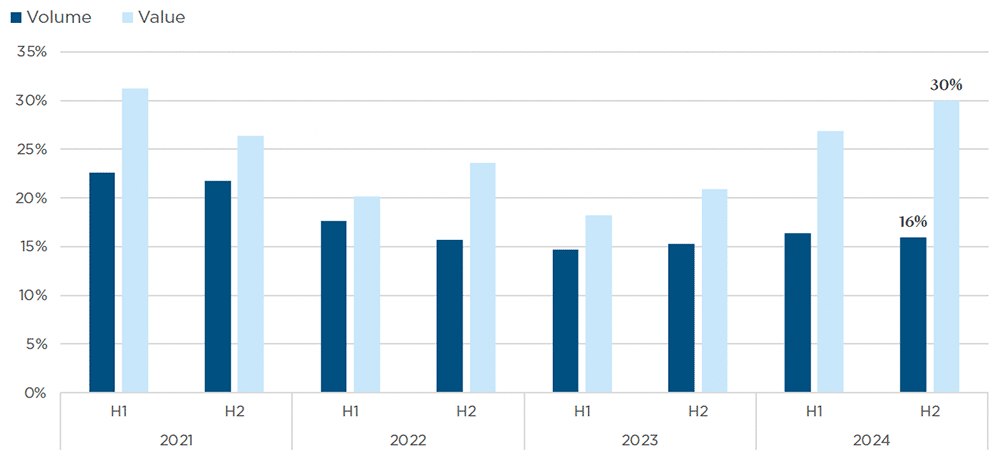
The M&A activity was supported by the continued recovery of the LBO mid-market since H1 2023, with a 2024 activity up 22% in volume and 65% in value. It was also fuelled by the strong rebound of Private Equity exits, with deal number up 40% in 2024 vs. 2023 (and 20% in S2 2024 vs. S1).
(1) Global M&A activity was up 10% in 2024 YTD to $2.9tn, according to LSEG in the FT, 10.12.2024
(2) Estimates as of 15.01.2025 by Epsilon Research / MarketIQ
Eurozone mid-market activity (€15–500m) in volume (# deals) and value
Source : Argos Index© mid-market / Epsilon Research
Eurozone Mid-market - Number of deals
Source : Epsilon Research / MarketIQ
(1) Does not include build-ups
Share of LBO in Eurozone Mid-market M&A
Source : Epsilon Research / MarketIQ


