Share
Main Conclusions
Historic record for the Argos Index® at 11.1x EBITDA
The Argos Index® reached 11.1x EBITDA, its highest ever.
Multiples are up in all segments in a context of low mid-market M&A activity. This strong increase is linked to:
• the prospects for a rebound in economic growth with the discovery of effective vaccines against Covid-19 – despite a second epidemic wave and a recession of -7.4% of GDP in 2020 for the euro zone.
• the massive intervention of central banks to keep long-term interest rates low.
But the level of the multiples can also be explained by the evolution of its composition. 65% of the transactions referenced in Argos Index® in the 4th quarter are for healthcare and technology sectors, a 15-points increase compared to the previous quarter. These sectors are spared, or even favoured, by the crisis, are not cyclical and have high multiples.

Argos Index® mid-market Median EV/EBITDA multiple on a six-month rolling basis
Source: Argos Index® mid-market / Epsilon Research
For the first time, multiples paid by private equity funds cross the 10x bar; they finally close the gap with the multiples paid by strategic buyers
Multiples paid by investment funds have risen sharply, by more than 20% to 11.2x EBITDA, a level not seen since the Argos Index® began in 2004.
Multiples are driven by the strong competition with strategic acquirers on companies not affected by the crisis, the ever-increasing level of investment in private equity1 and the access to low-cost acquisition debt (linked to central bank policies).
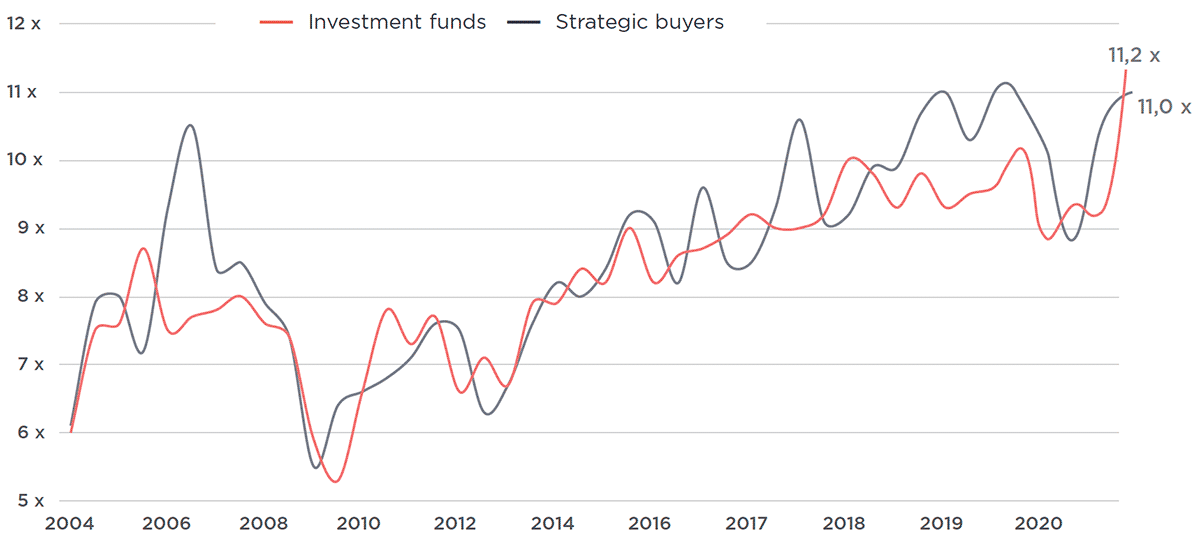
Argos Index® mid-market Median EV/EBITDA multiple on a six-month rolling basis
Source: Argos Index® mid-market / Epsilon Research
Multiples > 15x represent nearly 20% of the transactions
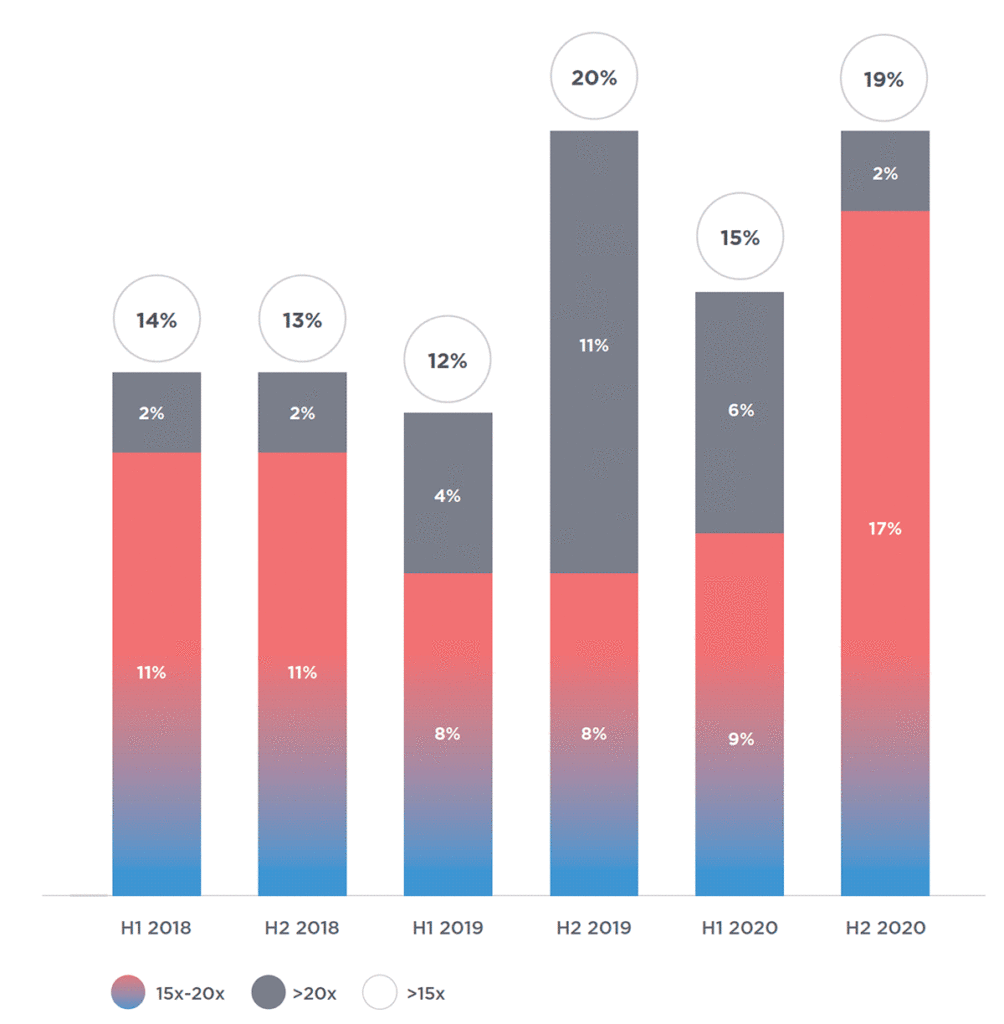
Percentage of transactions at multiples >15x EBITDA Argos Index® sample
Source: Argos Index® mid-market / Epsilon Research
Driven by a favourable market environment and consequently their higher valuations, listed companies were in a position to make opportunistic acquisitions
1 EV/LTM EBITDA of 10.1x, Euro Zone listed mid-market companies (source: smallcaps.infrontanalytics.com)
2 Total Assets held by the ECB is up 54% between Feb. and Oct. 2020 (Source: ECB in Duff & Phelps Valuation Insights Q4 2020)
3 EURO STOXX® TMI Small is up 15% in Q4 2020
Eurozone mid-market listed companies –
Argos Index® / strategic buyers –
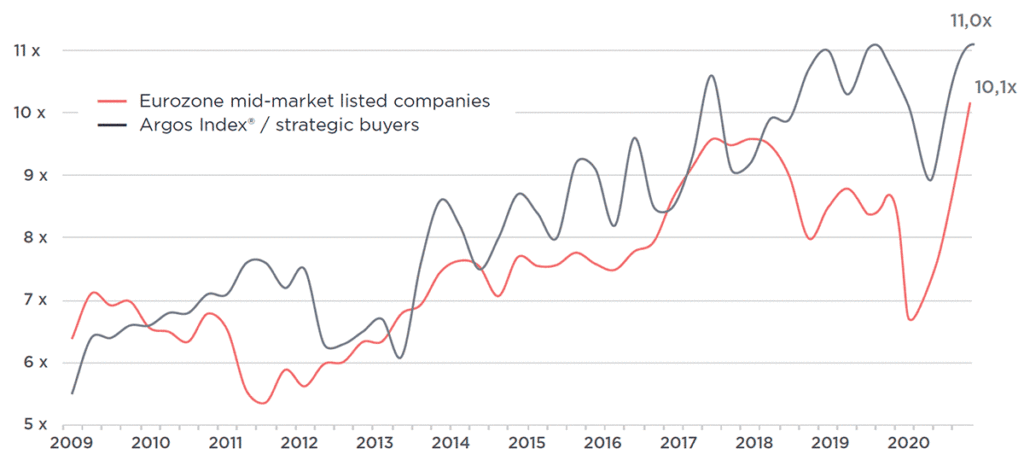
Source: Mid-market Argos Index® / Epsilon Research / InFront Analytics
Mid-market M&A activity remained weak in the fourth quarter and throughout 2020
Paradoxically, the sharp rise in the Argos Index® is taking place against a backdrop of low mid-market M&A activity.
In 2020, mid-market M&A activity fell by 15% in volume and 36% in value, logically marked by the strong economic recession and uncertainty in 2020 caused by the Covid-19 pandemic.
In the fourth quarter, the volume of mid-market activity was down 13% compared with the previous quarter but up 47% in value, returning to the level of the fourth quarter 2019.
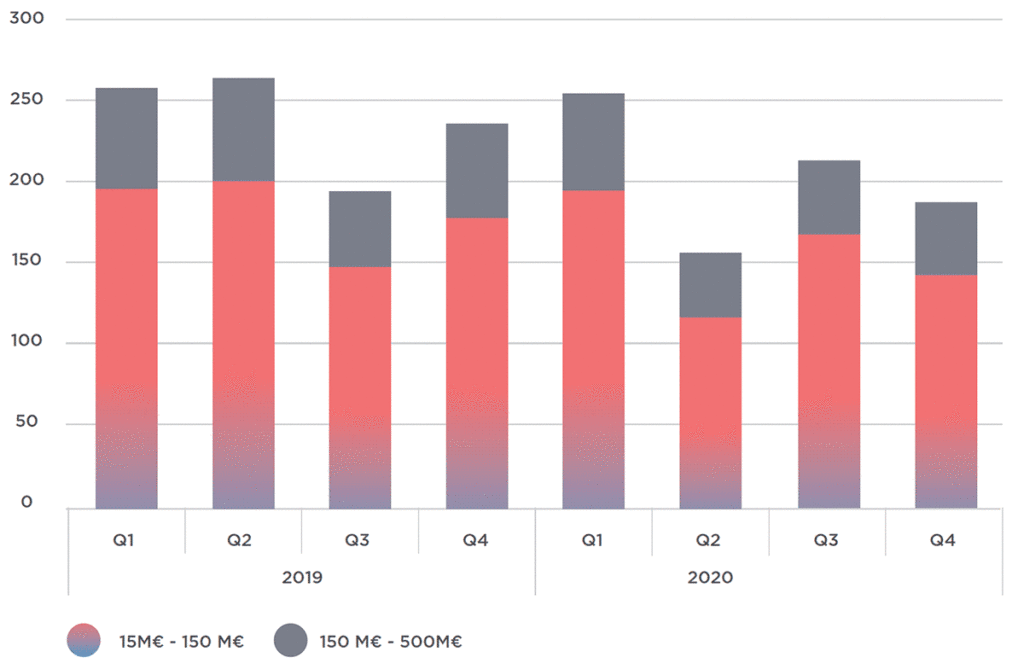
Eurozone mid-market activity (€15-500 million) in volume, by segment
Source: Epsilon Research / Market IQ
Of all sellers in mid-market transactions, nearly 50% were private individuals and families. Mostly driven by the fact that Corporates have been less active in their carve-out processes.
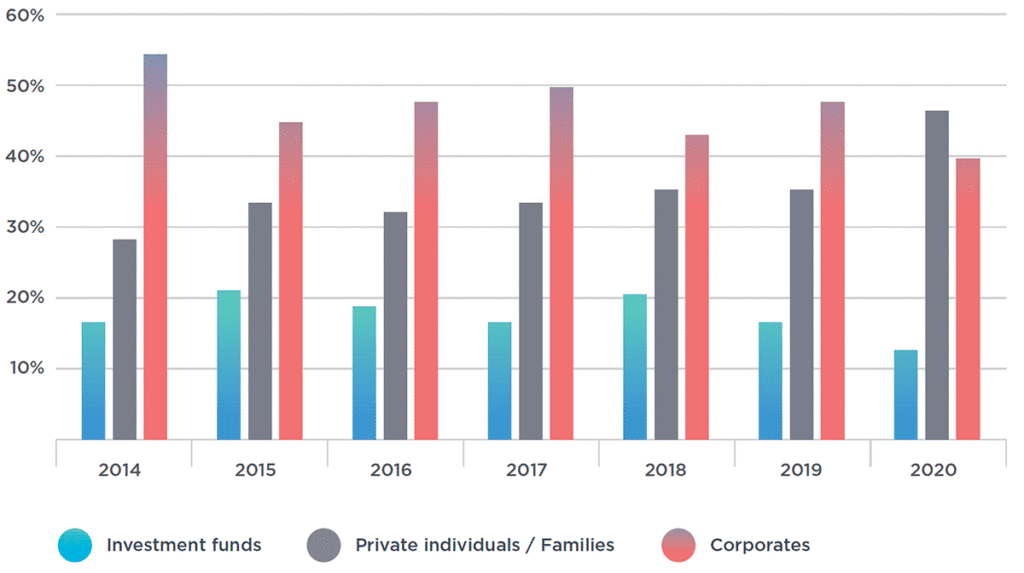
Typology of vendors – M&A Europe Zone Mid-Market
Evolution of market shares in number of transactions.
Source: Epsilon Research / MarketIQ


