Share
Main Conclusions
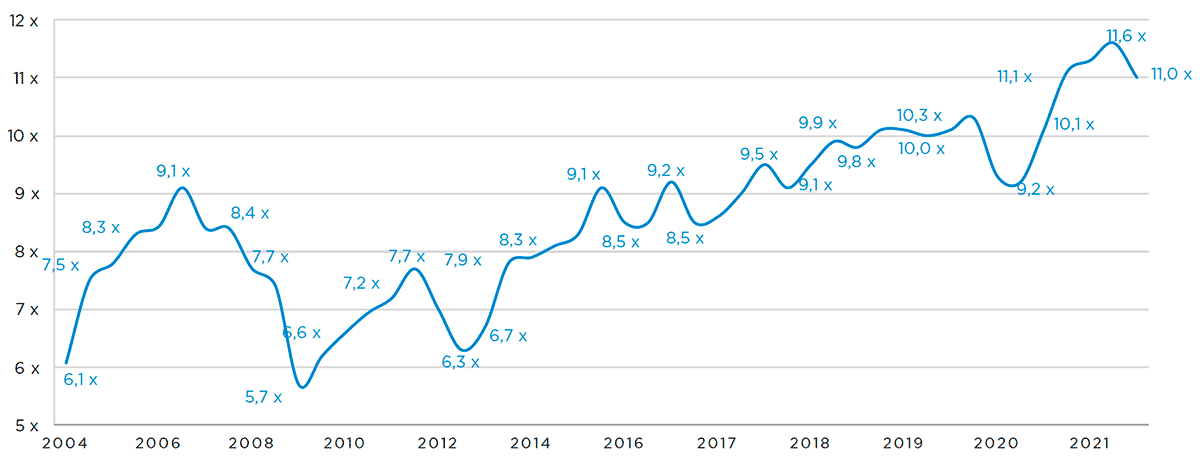
The Argos Index® declined to 11.0x EBITDA
The Argos Index® declined to 11.0x EBITDA in the third quarter of 2021 but remained at an historically high level.
This decline reflected lower prices paid by investment funds, at 11.3x EBITDA, after the record high reached in the second quarter. The decline brought prices closer to the 10.9x EBITDA paid by industry players.
The correction in the index also reflected changes in the sectoral make-up of the sample, which returned to its pre-Covid composition. The number of transactions in traditional sectors returned to normal. Specifically, the proportion of transactions in the healthcare and technology sectors returned to less than 40% in the third quarter of 2021.
Polarisation among sectors also increased. The index’s standard deviation was very high, in an atypical post-Covid context, where 2020/2021 figures are more difficult to interpret and cash flow is volatile.
Nevertheless, the index remained high because macroeconomic conditions remained particularly favourable. Economic growth has rebounded quicker and stronger than expected, as vaccination campaigns have been successfully rolled out across Europe, the European Union and its member states have provided massive support to the economy, and the ECB has maintained exceptional financial conditions. This environment has generated excess cash in search of returns.
Source: Argos Index® mid-market / Epsilon Research
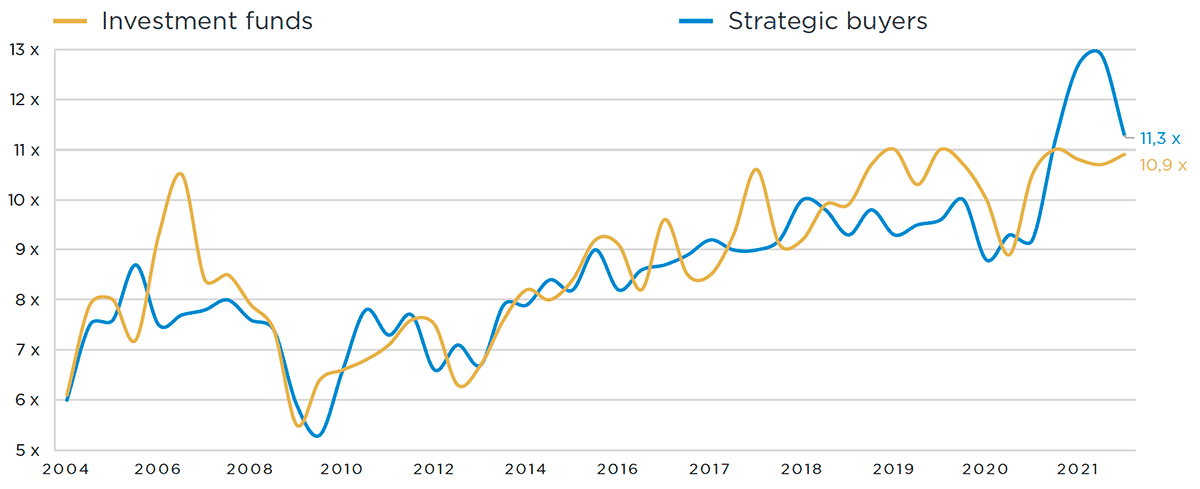
The multiples paid by investment funds contracted
The multiples paid by investment funds declined to 11.3x EBITDA after reaching a record high in the second quarter.
Transactions carried out during the period were less focused on healthcare and technology, and this had a direct impact on multiples.
Prices remained very high, however, and slightly higher than those paid by industry players. They continued to be supported by exceptional financing conditions, the oversupply of investment-seeking capital and by stiff competition on high-quality assets.
Worldwide investment fund activity (1) totalled $820 billion over the first nine months of 2021, a level unseen since the 1980s, and represented a quarter of the M&A market.
Source: Argos Index® mid-market / Epsilon Research
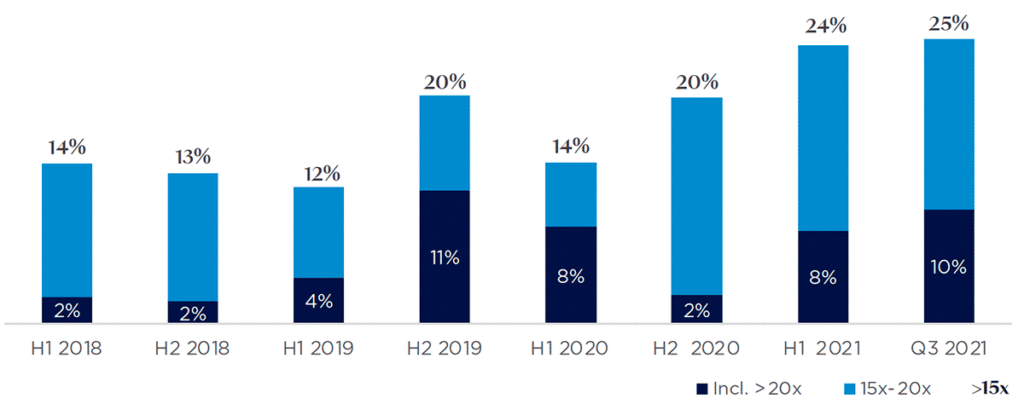
A quarter of transactions were carried out at multiples >15x EBITDA, a stable proportion
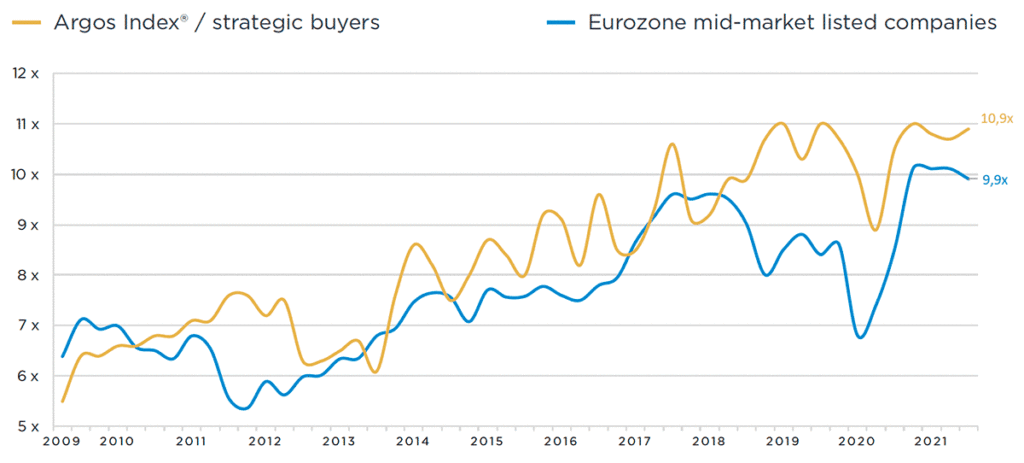
Listed companies were very active in the mid-market, buoyed by the rise in equity markets and the transformation of business models
The multiples paid by strategic buyers remained high in the third quarter, at 10.9x EBITDA. Large listed companies represented 78% of strategic buyers, in line with the first half and the highest since the Argos index was created.
Listed companies benefited from the continued rise in equity markets1 and from their own high multiples, despite a slight decline this quarter to 9.9x EBITDA2.
Their M&A activity was driven by the economic context, access to low-cost financing and a record level of available cash following the crisis3. It also reflected structural changes, such as digitalisation, ESG, and changes in consumer behaviour, which have prompted large companies in many sectors to transform themselves and have also led to strategic acquisitions.
1 The EURO STOXX® TMI was up 1.9% in Q3 2021 and has risen 63% since 1 April 2020.
2 EV/LTM EBITDA was 9.9x for listed, eurozone mid-market companies (source: smallcaps.infrontanalytics.com)
3 available cash of industrial companies worldwide was $5.2 trillion at end-2020, up 27% from 2019 – Source: Janus Henderson Global Dividend Index, July 2020
Source: Mid-market Argos Index® / Epsilon Research / InFront Analytics
Mixed mid-market M&A activity: stable in volume but down in value
Following the second quarter recovery, mid-market M&A activity stabilised in volume but declined in value terms compared with the previous quarter.
Worldwide M&A activity(1) was the highest ever recorded over the first nine months of 2021, at $4.4 trillion, driven by the vigorous economic recovery and the active acquisition strategies of major companies.
But recovery in the European mid-market has trailed that of its US counterpart as well as that of European large caps.
Mid-market companies have been more cautious. Transactions have been more complex for two reasons: the situation created by the Covid crisis is atypical and unstable, and the recovery has been rapid. Supply chains have been upended, energy and raw materials prices have soared, and demand has shot up. This has made financial information more difficult to interpret, cash flow more volatile and prices harder to set.
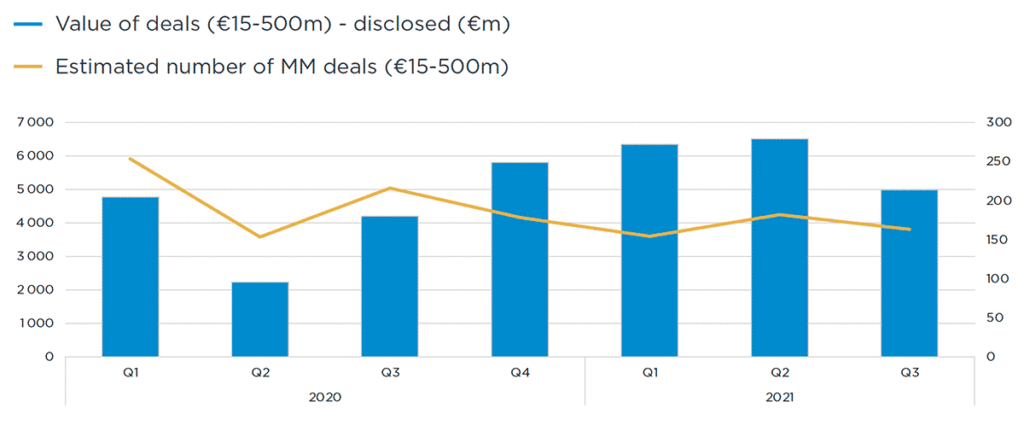
Eurozone mid-market activity (€15-500m) in volume and value
Source: Epsilon Research / Market IQ
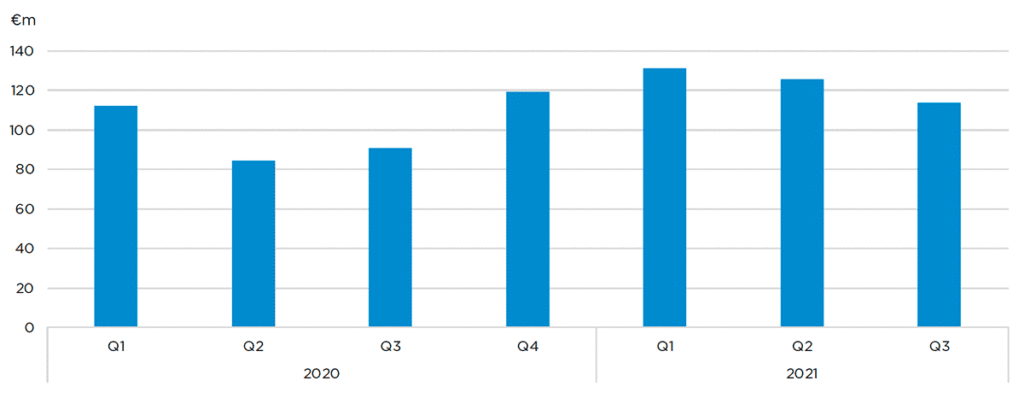
Source: Epsilon Research / Market IQ


