Share
Main Conclusions
The Argos Index® rose to 10.1x EBITDA
The index returned to its 2019 level. The Covid-19 pandemic seemed to subside during the summer, and the eurozone’s economic recovery was quicker than expected in the third quarter1. In this context, the Argos Index® was buoyed by the recovery in M&A activity, stock markets at record levels and high multiples of 11.8x EBITDA at the top end of the mid-market (equity value of €150-500 million).
The high proportion of transactions in sectors that have been spared by the crisis also explains the index’s return to a high level. Specifically, 50% of referenced transactions took place in the healthcare and technology sectors.

Argos Index® mid-market Median EV/EBITDA multiple on a six-month rolling basis
Source: Argos Index® mid-market / Epsilon Research
Strategic buyers driving multiples higher
Prices paid by strategic buyers were up, at 10.5x EBITDA. Large, listed companies were active in the mid-market and have represented more than 70% of strategic buyers since the beginning of the year. In particular, they have benefited from the rapid rise in equity markets1 and in their own multiples, which rose 9% to 8.5x EBITDA during the third quarter2.
The multiples paid by investment funds were stable at 9.2x EBITDA amid a reinvigorated transaction volume. LBO transactions were up 50% in volume compared with the second quarter. As investment funds still had considerable dry powder, they were able to resume their investment activity.
1 The EuroStoxx® TMI Small index appreciated by 20% between 1 April and 30 September 2020.
2 EV/LTM EBITDA of 8.5x for listed, eurozone mid-market companies (source: smallcaps.infrontanalytics.com)
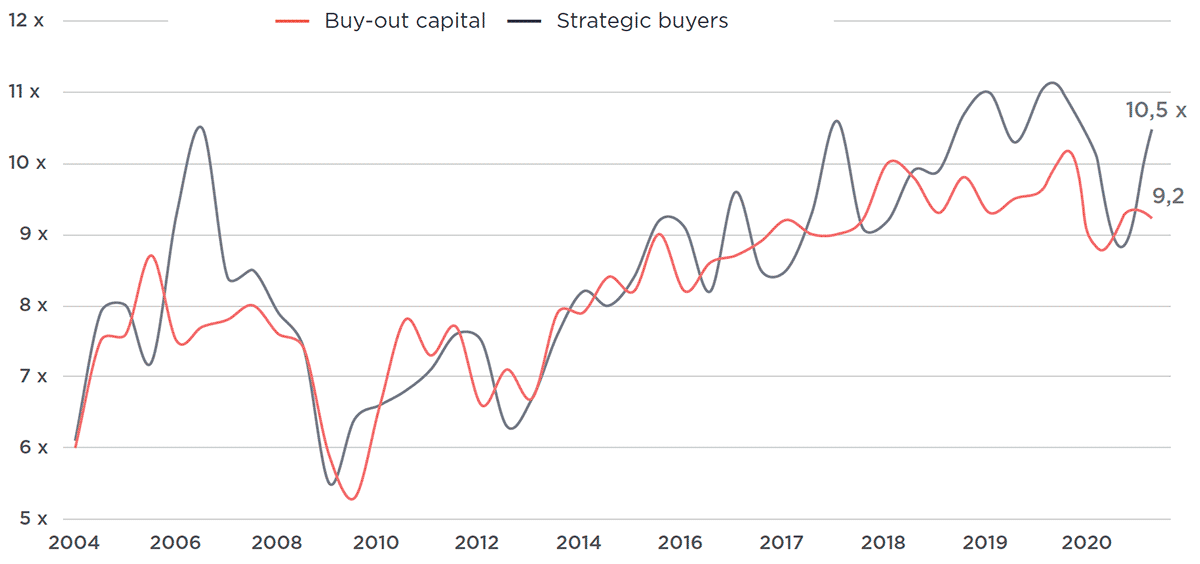
Enterprise value / historical EBITDA
Source: Mid-market Argos Index® / Epsilon Research
Decline in share of transactions at multiples > 20x EBITDA
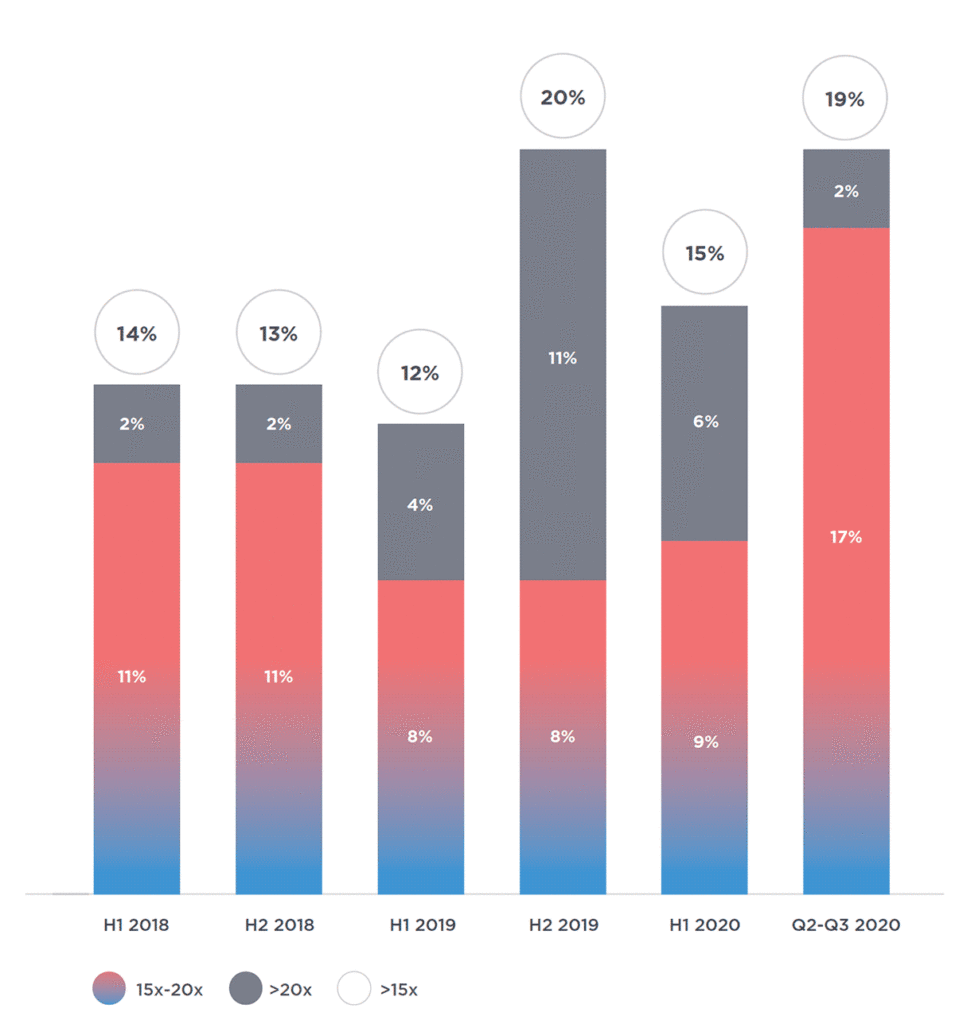
Percentage of transactions at multiples >15x EBITDA Argos Index® sample
Source: Argos Index® mid-market / Epsilon Research
The stock market recovery has not been enough to reduce the disparity between listed and unlisted companies
Transactions on unlisted companies continued to benefit from the massive central bank intervention we have seen, as cash continued to pour into the asset class1.
Multiples of unlisted companies remained 2x EBITDA higher than those of listed companies. This difference has been clearly visible for the past two years and was not eliminated by the stock market recovery during the third quarter.
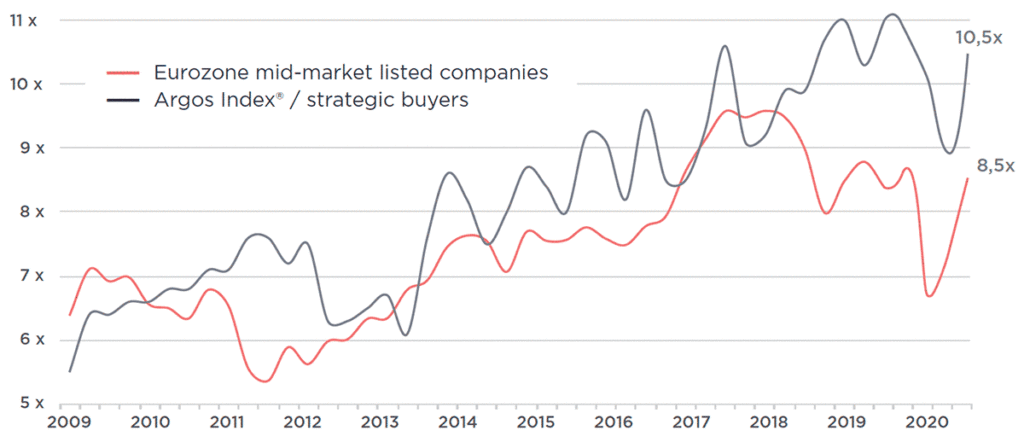
Comparison of listed and unlisted mid-market multiples (paid by strategic buyers)
Source: Mid-market Argos Index® / Epsilon Research / InFront Analytics
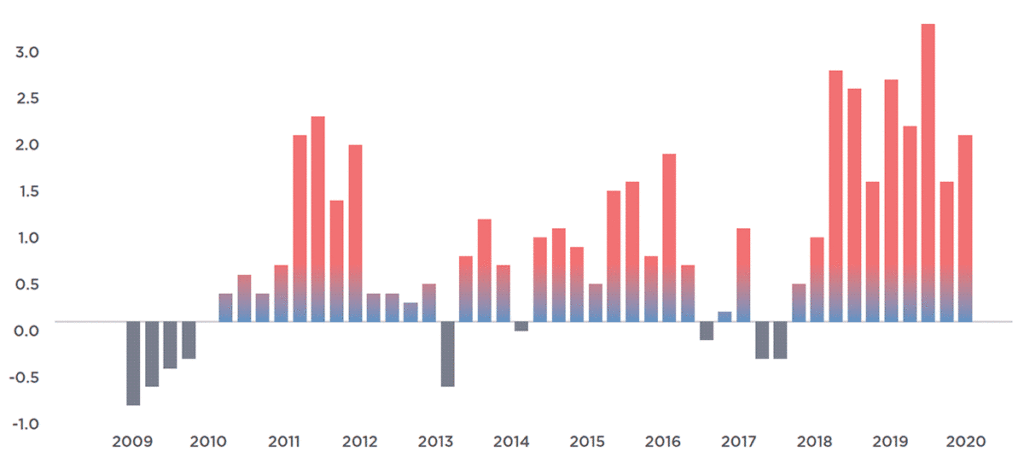
Comparison of listed and unlisted mid-market multiples (paid by strategic buyers)
Source: Mid-market Argos Index® / Epsilon Research / InFront Analytics
M&A activity recovered somewhat, but in the first nine months of 2020, it was still 13% below that of the year-earlier period.
Third-quarter mid-market M&A activity rose 40% in volume and 70% in value compared with the second quarter, in line with the overall M&A market1. This reflected both a catch-up effect and a greater-than-expected resurgence of economic activity in the third quarter2. But it did not return to its 2019 level. Over the first nine months of 2020, mid-market M&A activity was down 13% in volume and 46% in value terms compared with the same period in 2019.
1 Overall M&A activity up 21% in value in Europe during the third quarter. – Source: Refinitv/ Reuters
2 The eurozone economy rebounded much more strongly than expected in the third quarter after the pandemic-induced slump in the previous three months – source: www.nasdaq.com
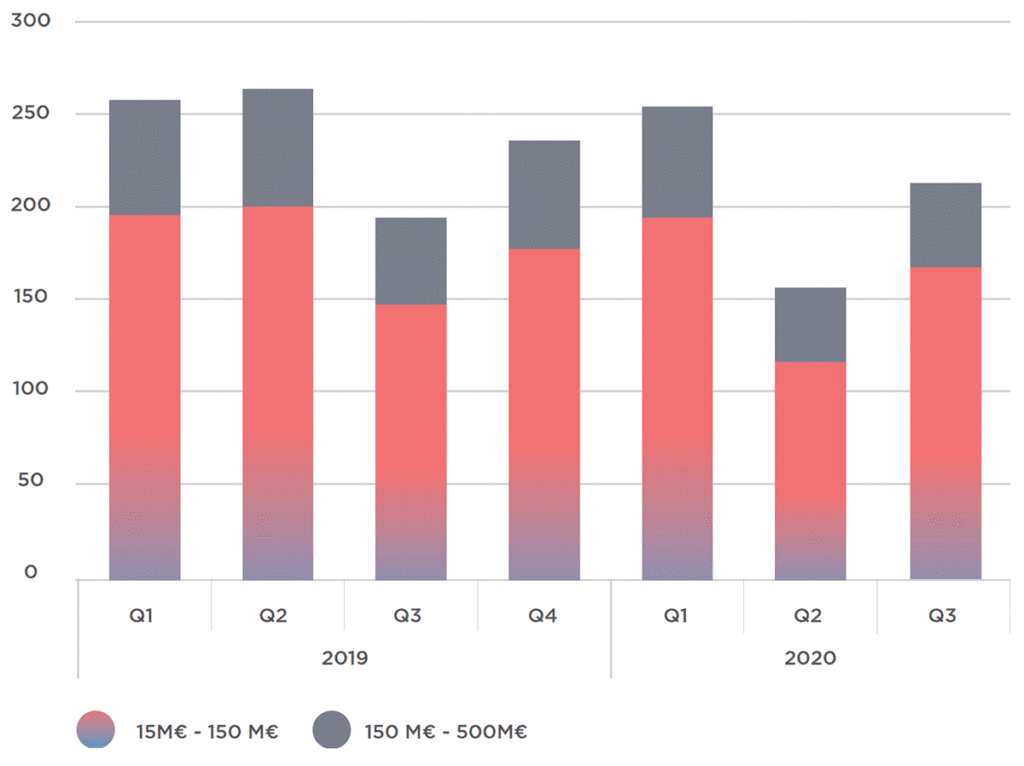
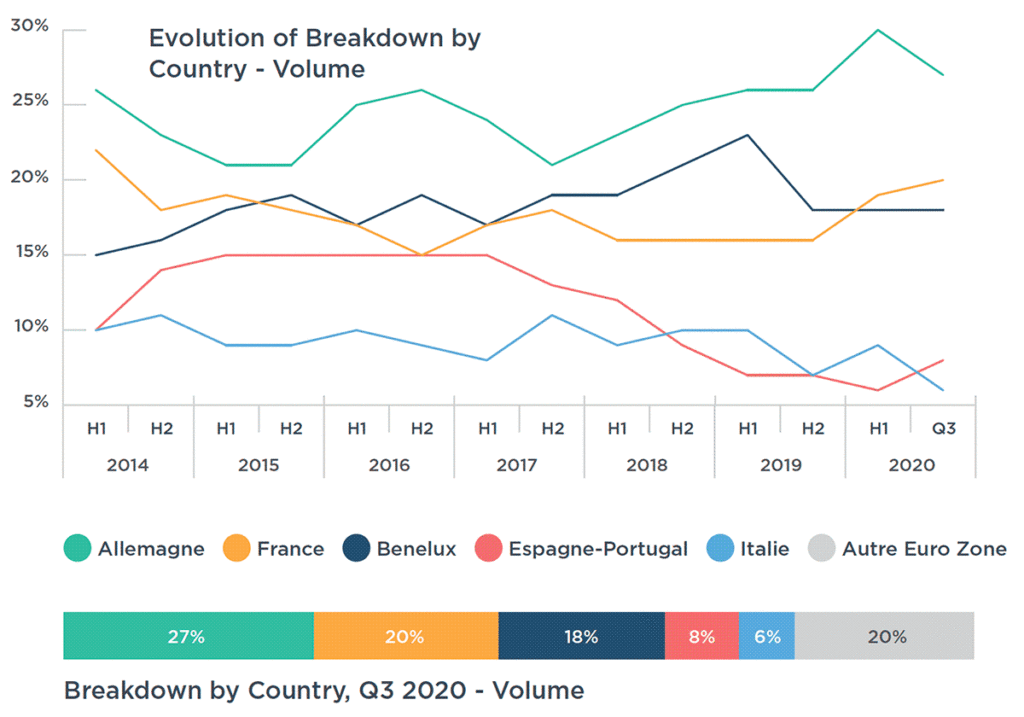
Germany was the most active eurozone country in terms of SME acquisitions, followed by Franc and Benelux
Several trends emerge from the differences in mid-market M&A activity among the main eurozone countries:
• Germany remains the most active market for mid-market M&A activity, with 27% of transactions in Q3 2020.
• France’s share held steady at 20% of mid-market transactions. Still, there was less activity in this segment in France than in Germany, in large part because SMEs account for a small portion of France’s economy.
• The share of the eurozone’s southern countries eroded. Italy and the Iberian peninsula represented only 6% and 8%, respectively, of eurozone mid-market transactions in the third quarter.
Unsurprisingly, the mid-cap M&A market recovered more in northern European countries, where the Covid-19 crisis was less disruptive than in southern Europe. It mirrored the divergence in economic performance between eurozone member states.
