Share
Main Conclusions
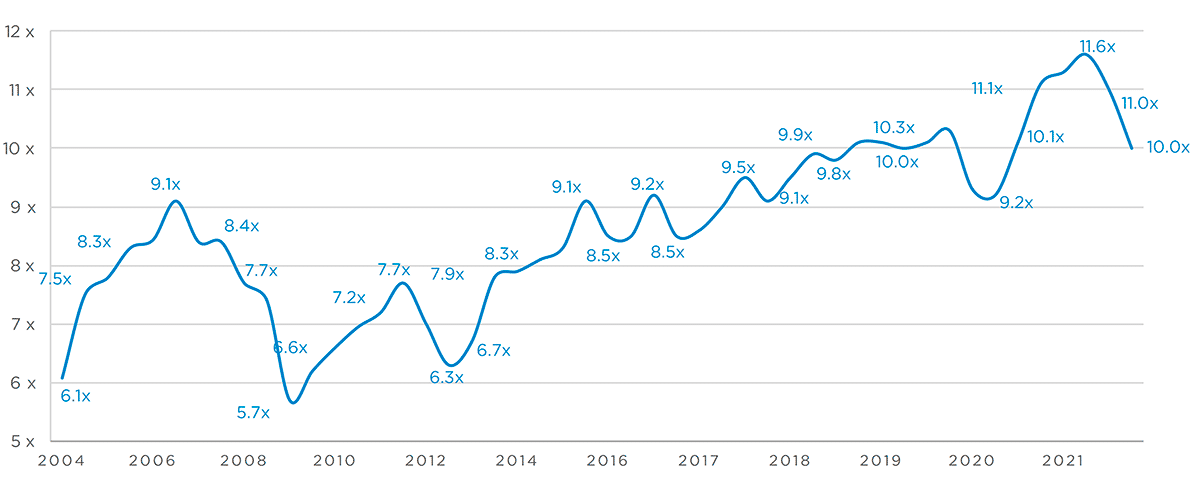
The Argos Index® continued to correct, returning to its multi-year average of 10.0x EBITDA.
In the fourth quarter of 2021, the Argos Index® continued to correct, declining 9% from the previous quarter to 10.0x EBITDA. This level, which corresponds to the average of the last five years (2017-21), is still historically high.
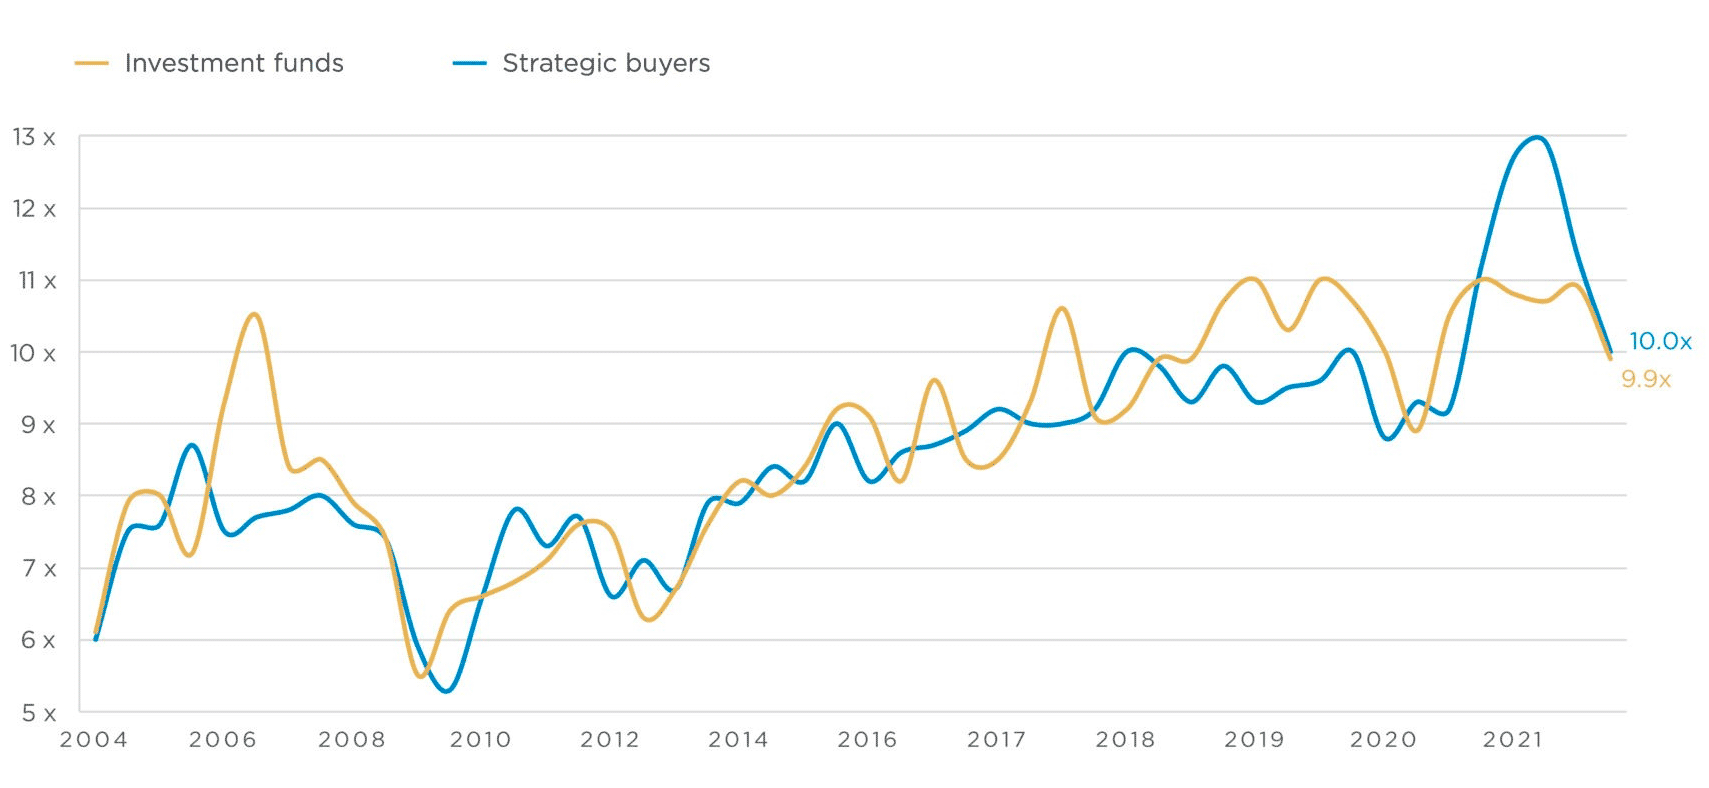
The decline was observed across all market segments. The multiples investment funds and industry players paid on the upper and lower mid-market converged towards 10x EBITDA.
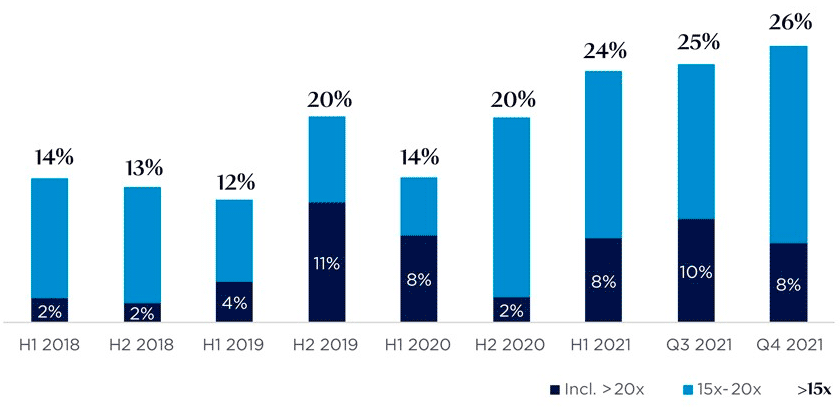
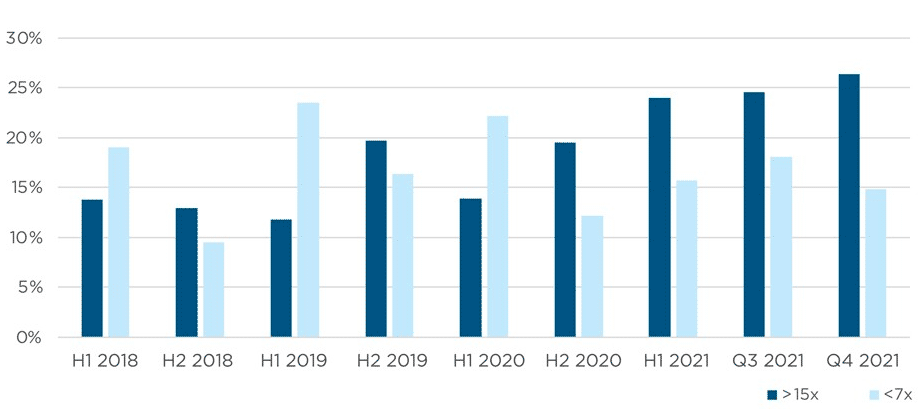
Although there seems to be little disparity in multiples, the market actually remained polarised across business sectors. The relative standard deviation of the index remained in excess of 50%, and the spread of multiples between tech-healthcare and manufacturing-services is very significant, at more than 4x EBITDA on average.
With the M&A market still active, acquisitions continued to gain momentum in manufacturing and services, reinforcing the decline in the index. As in the previous quarter, these sectors represented more than 60% of the sample, which returned to its pre-Covid sectoral composition.
The Argos Index® remained high as the M&A cycle continued to ramp up, driven by the sharp economic recovery and the very low interest rates central banks have maintained. But the index’s fourth quarter decline also reflected concerns about the consequences of the successive Covid-19 waves, the breakdown of value chains, the sharp rise in energy and raw materials prices and the likelihood of renewed inflation.
Argos Index® mid-market Median EV/EBITDA multiple on a six-month rolling basis
Source: Argos Index® mid-market / Epsilon Research
More market coherence, with convergence in the multiples paid by investment funds and strategic buyers
Argos Index® mid-market Median EV/EBITDA multiple on a six-month rolling basis
Source: Argos Index® mid-market / Epsilon Research
More dispersion in multiples
Listed companies were once again very active in the mid-market, although their multiples declined this quarter.
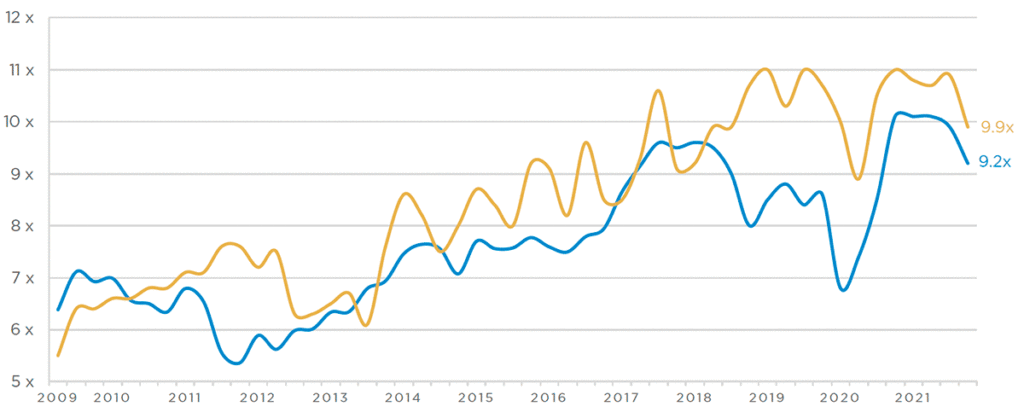
Multiples paid by strategic buyers were down this quarter, at 9.9x EBITDA* even though M&A activity, particularly that of large groups, remained buoyant. Large groups represented 72% of strategic buyers in the second half.
This decline was in line with that of the multiples of listed companies, at 9.2x EBITDA1 this quarter. Equity markets stabilised** at the end of the year at record-high levels, with an increase in 2021 operating earnings.
In many sectors, large companies continued to transform their business models and their approach to strategic acquisitions, against a very supportive economic and financial background.
** The EURO STOXX® TMI was up 2.8% in Q4 2021 and rose 1.9% in the third quarter.
Source: Mid-market Argos Index® / Epsilon Research / InFront Analytics
The volume of mid-market M&A activity remained high
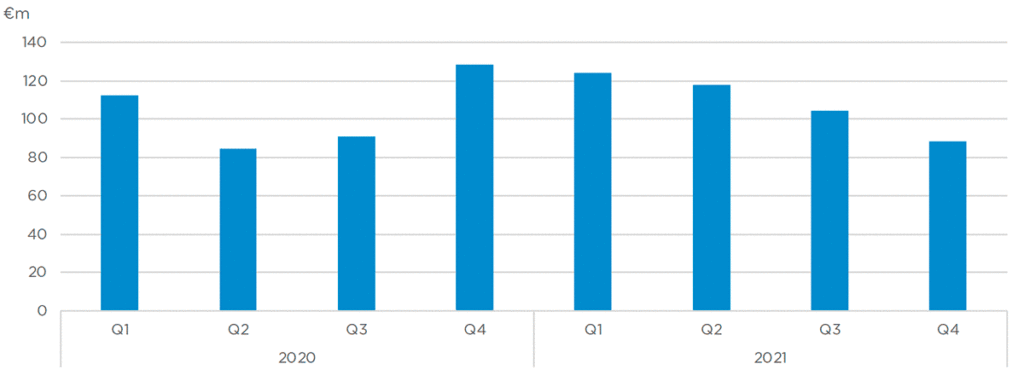
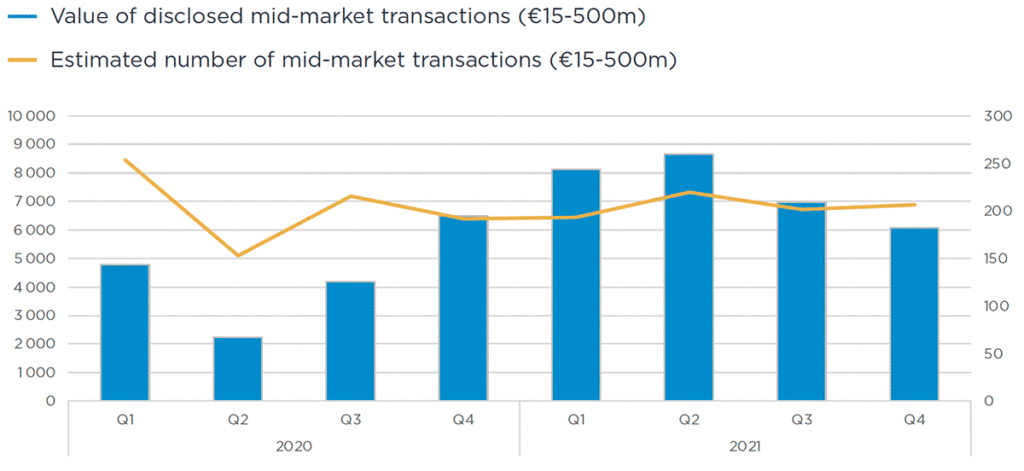
M&A activity increased by 2% in volume in the fourth quarter and remained at a high level. It declined by 13% in (declared) value, however, in line with the decline in average transaction amounts (€83m vs €104m in the third quarter).
Mid-market transactions did not increase as much as overall M&A activity, which returned to an upward cycle this year. Driven by the largest acquisitions, the worldwide market grew by more than 60% in volume in 2021 to $5.8tn*, the highest level in 40 years.
While large groups were very active, the unstable economic environment prompted mid-market companies to be more cautious, as they saw a strong recovery and a rapid rise in energy prices that could signal a return to inflation, combined with successive waves of Covid-19.
Source: Mid-market Argos Index® / Epsilon Research / InFront Analytics
